1. Purpose
The prototype attenuator was tested to establish four things:
- Correct operation of all six binary attenuation stages and the mute relay.
- Attenuation accuracy and the effect of the present 1% resistor population.
- Minimum safe relay timing for mute–change–unmute operation.
- Input and output impedance across the attenuation range.
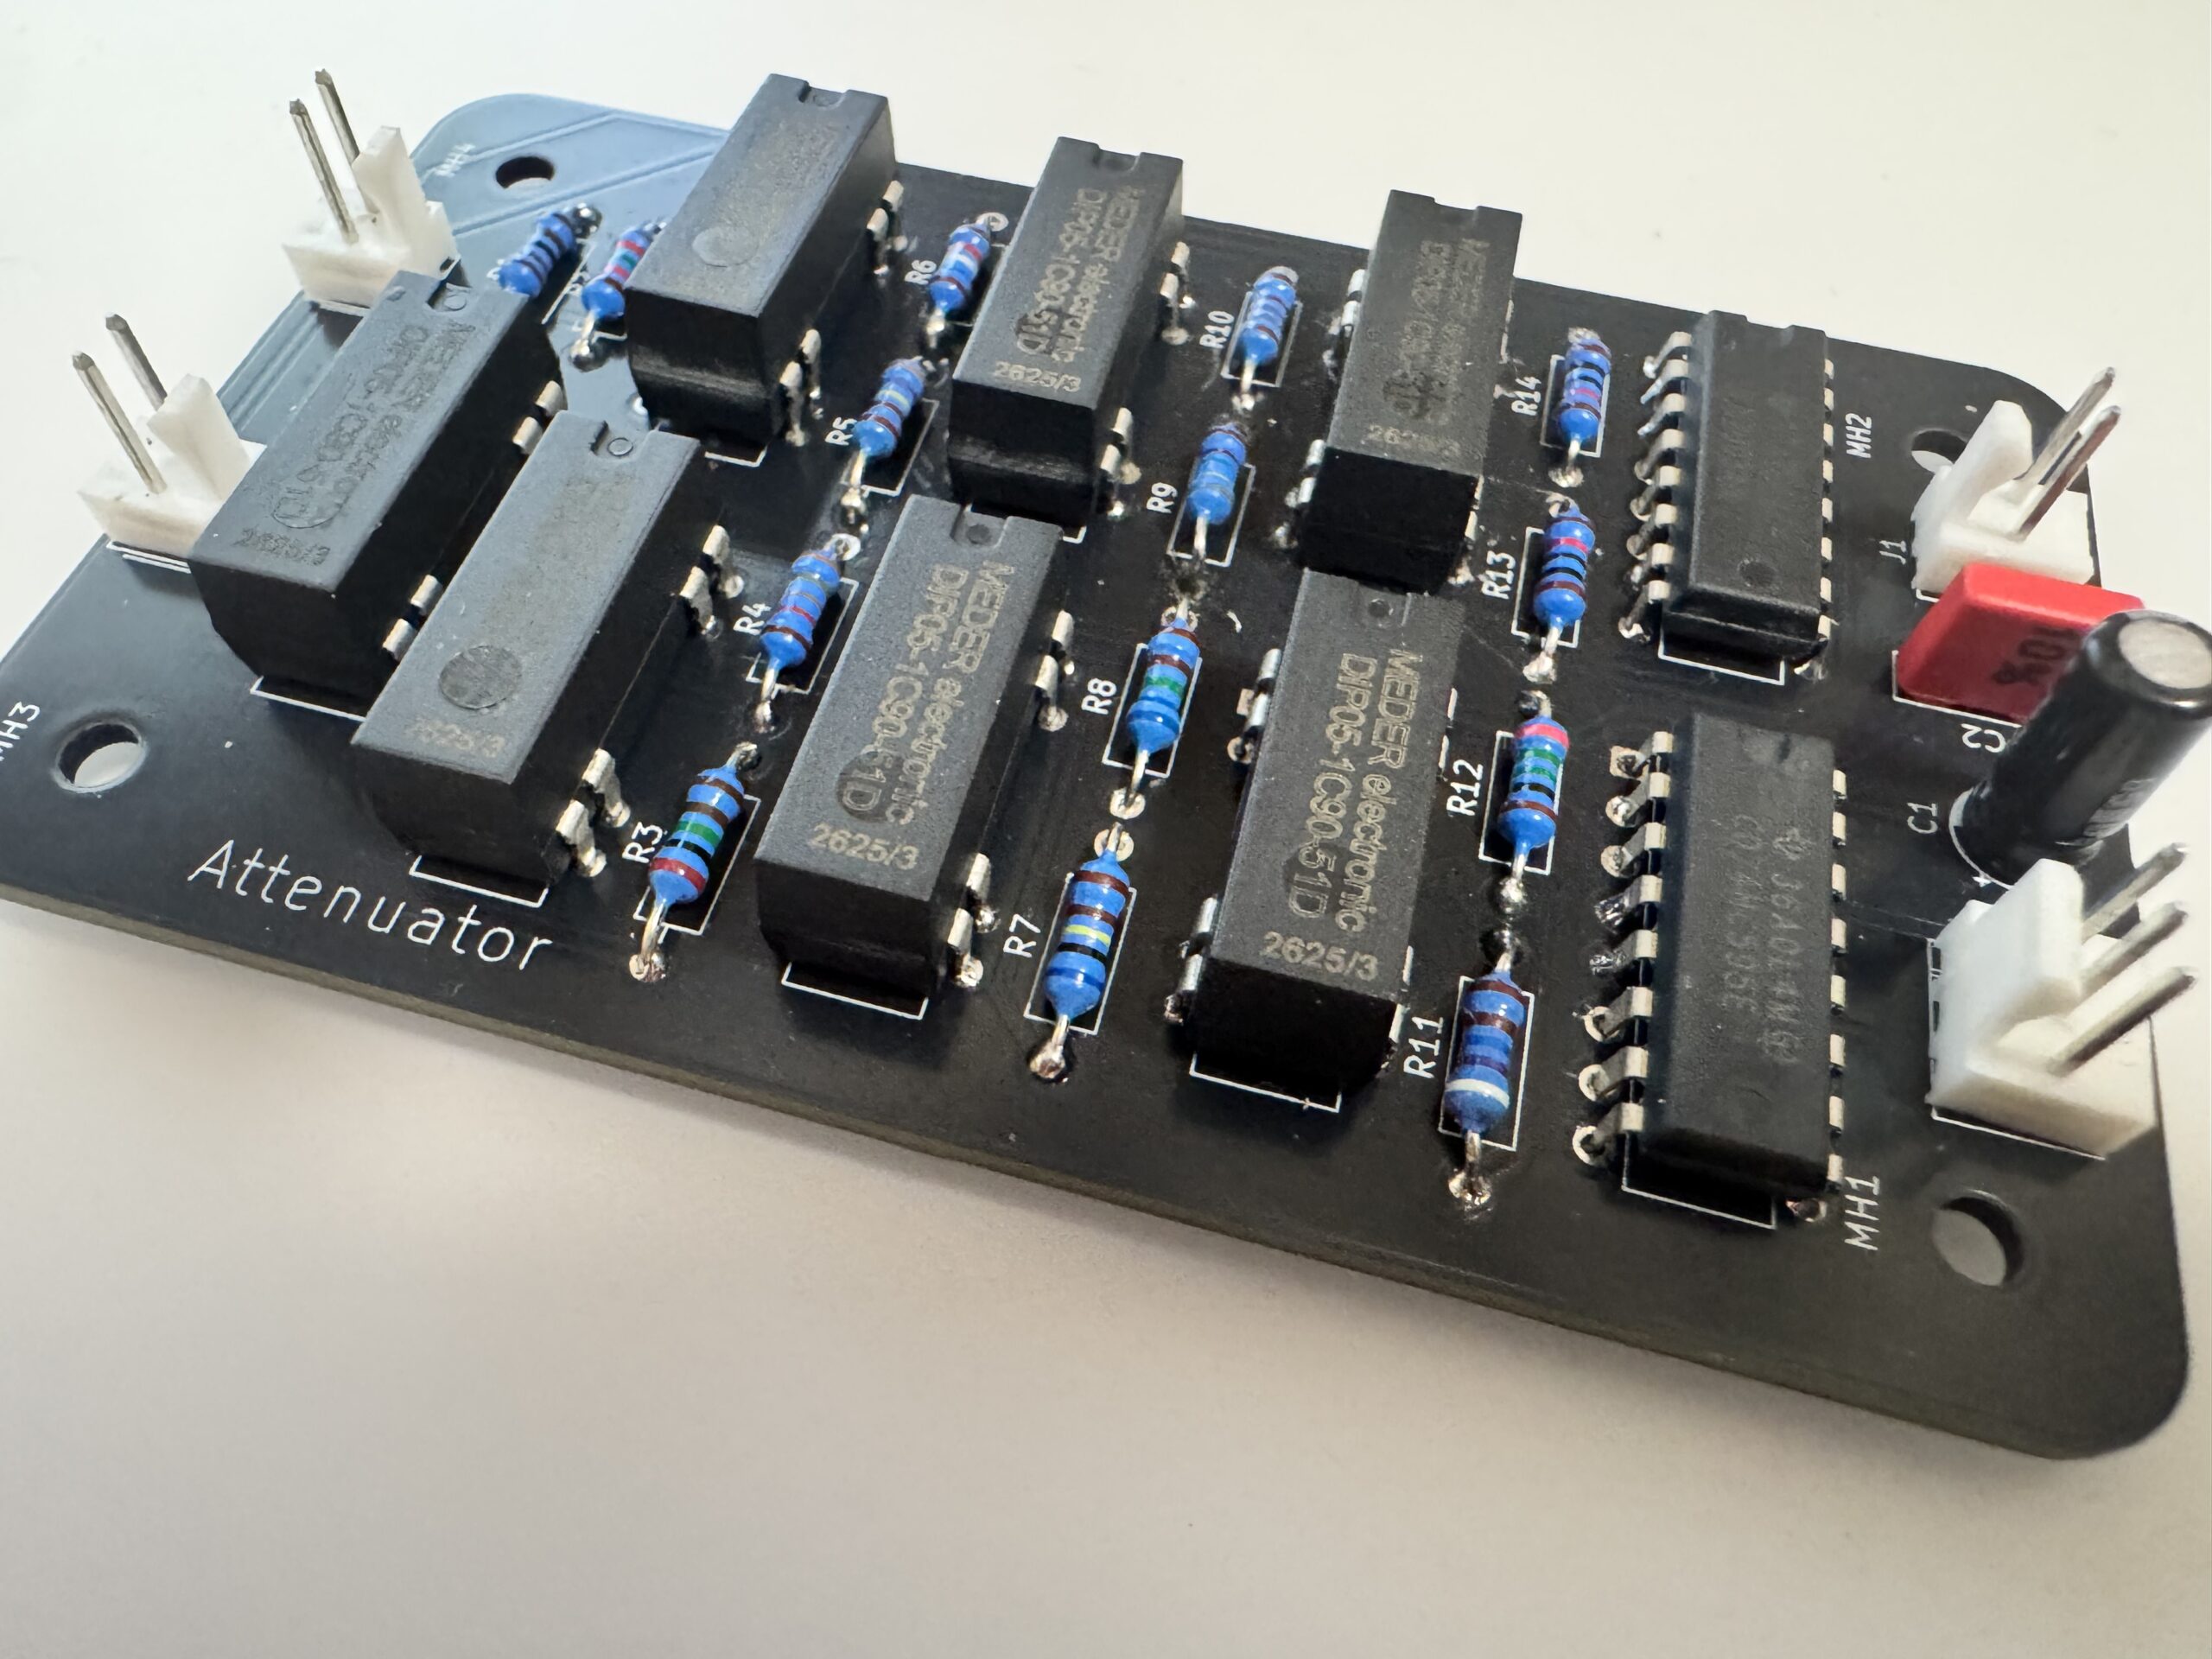
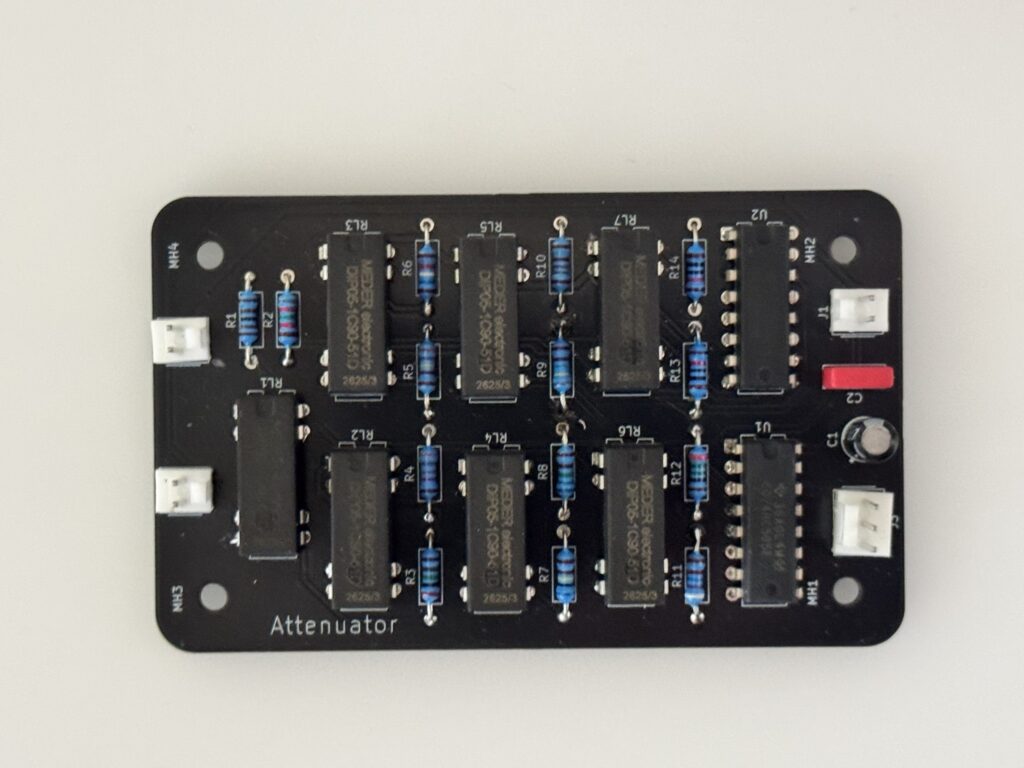
The prototype uses six relay-switched attenuation sections corresponding nominally to 1, 2, 4, 8, 16 and 32 dB, followed by a separate mute relay.
2. Attenuator control and polarity
The final control mapping established during testing is:
| 74HC595 output | Function |
|---|---|
| QA | 1 dB stage |
| QB | 2 dB stage |
| QC | 4 dB stage |
| QD | 8 dB stage |
| QE | 16 dB stage |
| QF | 32 dB stage |
| QG | Mute relay |
| QH | Unused |
The attenuation relay logic is inverted relative to the logical attenuation code:
- Relay energised: attenuation section bypassed.
- Relay released: attenuation section inserted.
Therefore a logical attenuation code of 000000 requires all six attenuation relays energised, while 111111 requires all six sections inserted.
The mute relay has a different function:
QG = 0: MUTE — output connected towards ground.QG = 1: PLAY — attenuator connected to output.
This is desirable because the unpowered state is muted.
The switching sequence is:
PLAY old attenuation
        ↓
command MUTE
        ↓
wait
        ↓
command new attenuation
        ↓
wait
        ↓
command PLAY
3. Attenuation sweep and resistor accuracy
A complete 64-code sweep confirmed that all 64 attenuation states are present.
Initially fewer steps appeared visible because the lower-voltage steps fell below the useful resolution of the original oscilloscope range. Increasing vertical sensitivity revealed the complete sequence.
3.1 Nominal and measured attenuation by binary stage
Using the full-range sweep and approximately 4.87 V as the unattenuated reference, the single-bit states gave:
| Logical code | Nominal stage | Series resistor | Shunt resistor | Nominal attenuation | Measured Vout | Measured attenuation | Error |
|---|---|---|---|---|---|---|---|
0x01 | 1 dB | 1.11 kΩ | 82.5 kΩ | 1.02 dB | ~4.36 V | 0.96 dB | −0.06 dB |
0x02 | 2 dB | 2.05 kΩ | 38.3 kΩ | 2.00 dB | ~3.91 V | 1.91 dB | −0.09 dB |
0x04 | 4 dB | 3.74 kΩ | 16.9 kΩ | 4.06 dB | ~3.10 V | 3.92 dB | −0.14 dB |
0x08 | 8 dB | 6.04 kΩ | 6.65 kΩ | 8.00 dB | ~2.00 V | 7.73 dB | −0.27 dB |
0x10 | 16 dB | 8.45 kΩ | 1.87 kΩ | 16.07 dB | ~0.85 V | 15.16 dB | −0.91 dB |
0x20 | 32 dB | 9.76 kΩ | 255 Ω | 32.10 dB | ~0.21 V | 27.31 dB | −4.79 dB |
The first four stages track the intended binary attenuation quite well. The 16 dB stage shows a larger deviation, while the 32 dB stage is the clear outlier in this prototype.
3.2 Effect of 1% resistor tolerance
The nominal resistor network is close to the intended binary values. With ±1% tolerance independently on the resistors of each section, approximate stage error remains relatively small:
| Stage | Approx. error from 1% resistor tolerance |
|---|---|
| 1 dB | ±0.011 dB |
| 2 dB | ±0.022 dB |
| 4 dB | ±0.045 dB |
| 8 dB | ±0.084 dB |
| 16 dB | ±0.135 dB |
| 32 dB | ±0.167 dB |
If all six errors happened to accumulate in the same direction, the extreme theoretical total error is of order 0.45–0.5 dB.
The measured 32 dB deviation is therefore not consistent with ordinary 1% resistor tolerance alone. The prototype may also contain actual resistor-value deviations, assembly tolerance, relay/contact effects, or other implementation effects.
For the prototype this is not considered a serious concern.
For the R-channel build, the plan is to use 0.1% resistors. This should reduce the resistor-tolerance contribution by approximately a factor of ten. The cumulative theoretical tolerance error would then be on the order of only 0.05 dB worst case.
The R channel will therefore also provide a useful controlled comparison:
L channel        existing resistor population
R channel        0.1% resistor population
Measuring the actual 0.1% parts before assembly will allow the measured attenuation curve to be compared directly with the curve predicted from the fitted values.
4. Relay timing and mute test
The most demanding attenuation transition is:
0x1F = 011111
0x20 = 100000
All six attenuation relays reverse state at this boundary. This was therefore used as the relay stress test.
The test repeatedly alternated:
0x1F → 0x20 → 0x1F → ...
using:
MUTE old code
wait
CHANGE all six attenuation bits
wait
UNMUTE
4.1 Experimental result
The critical timing was found to be the delay after commanding the attenuator change, not the initial mute lead time.
The mute lead could be reduced experimentally to approximately 1 µs without causing the observed spike.
By contrast:
ATT_SETTLE = 200 µs
produced repeatable spikes at the worst-case transition.
As the interval was increased, the spikes became intermittent: some transitions were clean and some were not.
At:
ATT_SETTLE = 220 µs
the spikes disappeared in the stress test.
This indicates that the test is observing the relative mechanical timing of the mute relay and attenuation relays, rather than digital propagation delays.
The 1 µs result does not imply that the mechanical mute relay moves in 1 µs. It means that the mute relay, once commanded, reaches the safe contact state early enough relative to the attenuation relay movement that no additional software lead time is required in this relay combination.
4.2 Adopted operating margins
Rather than operate at the measured limit, the chosen values are:
MUTE_SETTLE_US = 200;
ATT_SETTLE_US  = 500;
Thus the command sequence is:
command MUTE
     200 µs
command attenuation
     500 µs
command PLAY
Total programmed command interval:
700 µs
The actual acoustic mute interval is determined additionally by the mechanical operate/release times of the relays, so it should not be assumed to equal exactly 700 µs.
This is substantially better than the original design allowance of approximately 5 ms.
4.3 User-interface implication
A practical controller update interval of approximately 50 ms is therefore very conservative.
The relay-protected transition occupies only a small fraction of that interval. Rapid encoder movements can be coalesced into target-volume updates rather than operating the relays for every individual encoder edge.
Bluetooth-controlled volume changes can similarly be ramped through several intermediate attenuation values. For example, a large requested change could be implemented as five intermediate changes over about 50 ms, each protected by the same mute/change/unmute sequence.
The 0x1F ↔ 0x20 transition is also a useful candidate for a production board self-test, since it exercises the maximum simultaneous relay change.
5. Input impedance
Input impedance was measured with:
DC source          5.0 V
series resistor    9.87 kΩ
measurement        attenuator input to ground
Across almost the complete attenuation sweep the measured input voltage remained around:
2.48–2.50 V
For a series test resistor R_s:
$$Z_{in}=R_s\frac{V_{in}}{V_s-V_{in}}$$
At 2.50 V:
$$Z_{in}=9.87\,k\Omega$$
At 2.48 V:
$$Z_{in}\approx 9.71\,k\Omega$$
So the measured input impedance is approximately:
9.7–9.9 kΩ, with most settings very close to 9.87 kΩ.
Transient points during relay switching were excluded from this assessment.
This confirms that the attenuator presents an effectively constant 10 kΩ input impedance across its operating range.
6. Output impedance
Output impedance was measured by comparing the unloaded output with the output loaded by:
RL = 9.87 kΩ
using:
$$Z_{out}=R_L\left(\frac{V_{OC}}{V_L}-1\right)$$
The result varies with attenuation setting, as expected for this passive attenuator topology.
Measured values lie generally in the low-kΩ range, with the worst region around approximately 3–3.5 kΩ.
Representative measured values were:
| Code | Unloaded V | Loaded V | Calculated Zout |
|---|---|---|---|
| 0 | 4.73 V | 4.65 V | ~0.17 kΩ |
| 1 | 4.25 V | 3.80 V | ~1.17 kΩ |
| 2 | 3.80 V | 3.21 V | ~1.81 kΩ |
| 3 | 3.42 V | 2.74 V | ~2.45 kΩ |
| 4 | 3.01 V | 2.40 V | ~2.51 kΩ |
| 5 | 2.70 V | 2.09 V | ~2.88 kΩ |
| 6 | 2.42 V | 1.83 V | ~3.18 kΩ |
| 7 | 2.17 V | 1.62 V | ~3.35 kΩ |
| 8 | 1.95 V | 1.53 V | ~2.71 kΩ |
| 15 | 0.89 V | 0.66 V | ~3.44 kΩ |
| 16 | 0.81 V | 0.70 V | ~1.55 kΩ |
| 20 | 0.53 V | 0.45 V | ~1.75 kΩ |
| 24 | 0.36 V | 0.30 V | ~1.97 kΩ |
| 31 | 0.15 V | 0.13 V | ~1.52 kΩ |
The characteristic pattern is that output impedance rises within a binary range, then resets downward at major bit boundaries.
The increased-sensitivity 100 mV measurements confirmed the same general behaviour in the deeper attenuation region, although scope resolution and clipping prevent every code from being evaluated with equal precision.
7. Interaction with the following preamplifier
The preamplifier following the attenuator has an input impedance of approximately:
1 MΩ
Even taking a conservative attenuator output impedance of 3.4 kΩ:
so the impedance ratio is almost 300:1.
The corresponding worst-case loading loss is approximately:
This is negligible.
The attenuator therefore interfaces very comfortably with the 1 MΩ preamplifier input.
8. Conclusions
The prototype has validated the basic attenuator architecture well.
Functional behaviour
All six binary stages and all 64 codes operate. Relay polarity and the separate mute function are now understood and correctly controlled.
Attenuation accuracy
The first four measured binary stages track the intended 1, 2, 4 and 8 dB values closely. The 16 dB stage shows more error, and the 32 dB stage is the clear outlier in the prototype.
Ordinary 1% resistor tolerance can account for some error, but not the full measured deviation of the 32 dB stage. The planned R-channel build using measured 0.1% parts will provide a useful comparison.
Relay muting
The worst-case 0x1F ↔ 0x20 transition became consistently clean once the post-attenuator-change interval reached approximately 220 µs.
Using:
mute lead        200 µs
attenuator settle 500 µs
provides substantial margin while retaining a total programmed transition interval of only about 700 µs.
Input impedance
The measured input impedance remains approximately 10 kΩ across the sweep.
Output impedance
The output impedance remains in the low-kΩ range, peaking at approximately 3–3.5 kΩ.
Preamp loading
With the following preamplifier at 1 MΩ, loading is negligible, with a worst-case calculated attenuation effect of only about 0.03 dB.
Overall assessment
The prototype architecture—binary relay ladder, separate ground mute, and controlled mute/change/unmute sequencing—is technically sound and suitable to carry forward to the next revision.
Leave a Reply