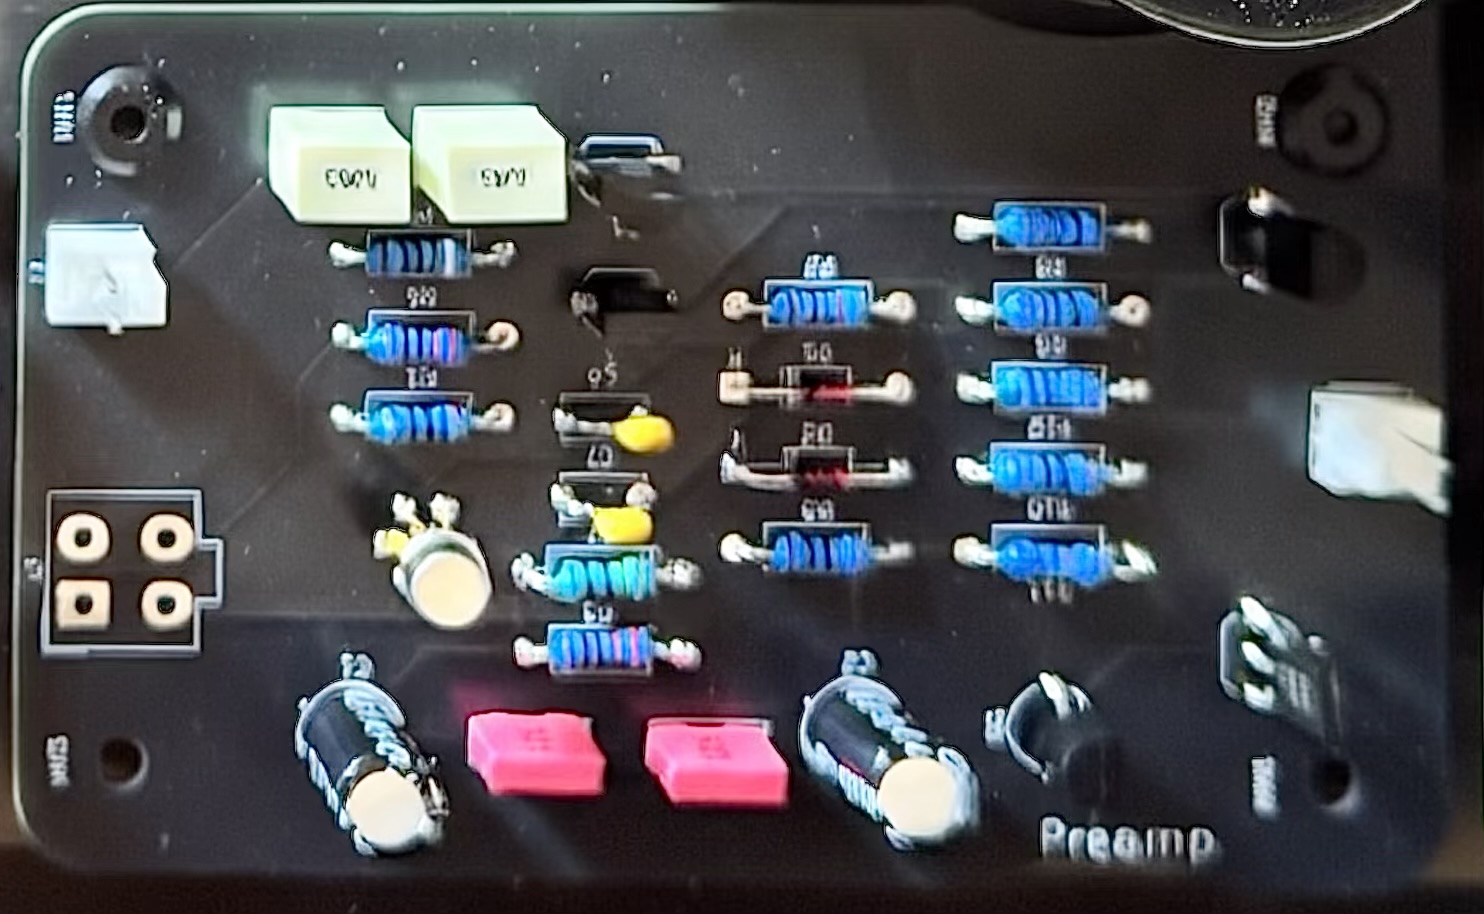
The Field 25 preamp on the bench — what it does, and what I cannot yet attribute
The preamp board came back from fabrication at the end of October. Last week I put it on the bench and measured it properly for the first time. This is the account of that session, including the numbers that are weaker than I would like.
The board
Field 25 is a 25 W amplifier. The preamp is its first stage, and it is deliberately a conventional one: an LSK389A JFET pair at the input, a PNP voltage gain stage, and an NPN emitter follower with a constant-current pull-down driving the output. Two resistors, R6 and R8, set the closed-loop gain at 2 — six decibels — and that is the whole of the gain in the preamp.
One design detail matters for reading the measurements. The feedback is taken before the 47 Ω output isolation resistor R12, not after it. That is the right place to take it if you want the stage’s own gain to be defined, but it means the load at the output connector can change what the instrument measures. Any gain figure here is the gain with the load that was actually attached, which I did not record. I will come back to that.
How it was measured
A signal generator drove the preamp; a two-channel oscilloscope exported waveform samples to CSV; the analysis fitted a common sine to both channels at each frequency and converted amplitude and phase into gain and phase difference. Gain is output over input. Phase is output minus input, so a positive number means the output leads.
The standard captures were about 0.35 V RMS at the input and 0.70 V RMS at the output. The 1 kHz files record ×10 probes and 0.2 V/div on both channels.
What I did not record is as important as what I did: the scope and generator models, the actual rail voltages, the external load, and the probe grounding geometry. I tried the scope’s 20 MHz bandwidth limit during the later pickup investigation and cannot now confirm its state across the whole capture set. A report that hides that is worth less than one that says it.
Gain and phase
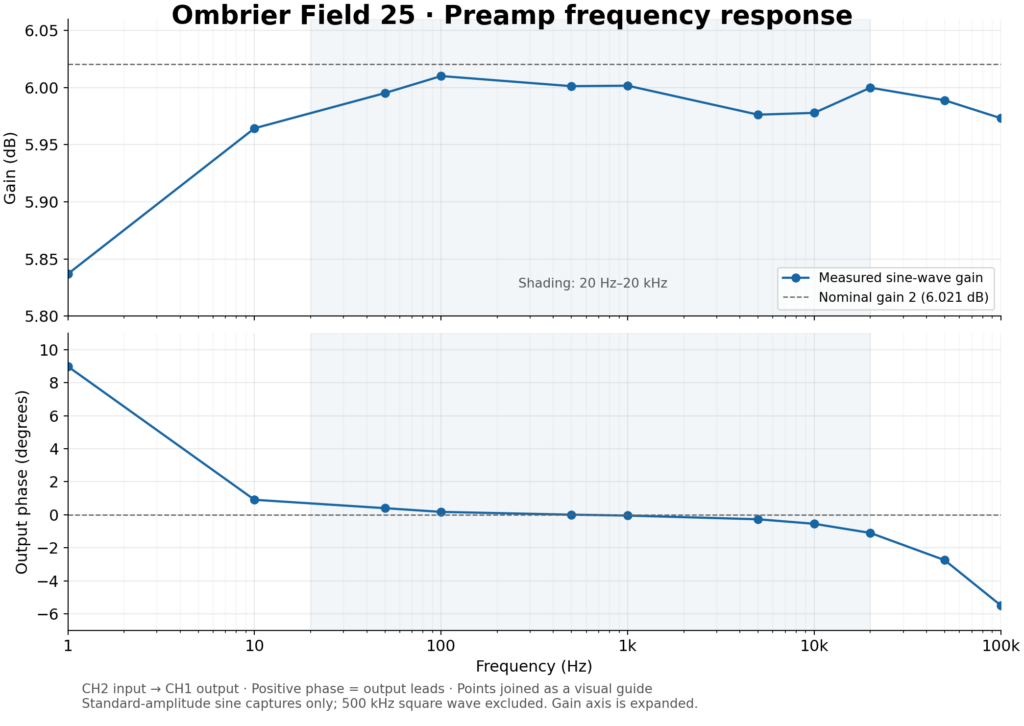
The figure at the head of this article plots these numbers. Read the gain axis carefully: it runs 5.80 to 6.05 dB, so what looks like a mountainous trace is a variation of two hundredths of a volt per volt.
At 1 kHz the gain measured 1.996 V/V, which is 6.002 dB against a nominal 2.
From 10 Hz to 20 kHz the gain stayed between 1.987 and 1.998 — a total spread of 0.046 dB. That is the number I care about most in this whole set. It says the stage is flat where hearing is, and it says it without the help of a smoothing curve.
At 1 Hz the gain fell to 1.958 V/V and the phase led by 8.98°. That is a high-pass corner near 0.16 Hz, which is what C5 at 1 µF into R2 at 1 MΩ should give. So the low-frequency behaviour is the coupling network doing exactly what the arithmetic predicts, not the amplifier doing something interesting.
Phase across the band: +0.17° at 100 Hz, −0.05° at 1 kHz, −1.10° at 20 kHz, and −5.49° at 100 kHz. From 5 kHz upwards the lag is very nearly proportional to frequency, which is the signature of a plain time delay — about 153 ns in this setup. Some of that is the preamp and some of it is the probes and the difference in channel timing, which I did not calibrate. So 153 ns is an upper bound on the stage’s own delay, not a measurement of it.
The sweep stopped at 100 kHz. The upper −3 dB point is still outside the measured range; I have not found it.
The step response
Two square-wave captures were analysed. With a 0.203 V output step, the rise and fall times were both about 245 ns (10–90%), consistent across three rising and three falling edges after light smoothing, with an indicative uncertainty of ±10–20 ns. With a 2.02 V step, rise was about 420 ns and fall about 450 ns, an average slew of 3.8 V/µs over the 10–90% rising interval.
The stage is faster at small amplitudes than at large ones, which is what running out of current looks like: plenty of small-signal bandwidth, and a slew limit when the step gets big. Converting the 245 ns figure through a single-pole model gives roughly 1.4 MHz. That is an estimate from a model, not a measurement — a low-level sine sweep would settle it properly, and I have not run one.
Distortion, and why the number is not printable
Total harmonic distortion was calculated by fitting a common fundamental and harmonics 2 through 10 to each waveform, and taking the root-sum-square of the harmonics over the fundamental. Broadband noise is excluded.
| Test frequency | Input THD | Output THD |
|---|---|---|
| 100 Hz | 0.61% | 0.64% |
| 1 kHz | 0.83% | 0.86% |
| 5 kHz | 1.08% | 0.89% |
Read the input column before the output column. The signal going in already carries 0.83% distortion at 1 kHz, and at 5 kHz it carries more than the output does. At 1 kHz, the second harmonic alone was 0.828% at the input and 0.859% at the output.
It is tempting to subtract one from the other and announce that the preamp contributes 0.03% THD. That would be wrong. Harmonic voltages add with phase, so percentages cannot be subtracted; the honest statement is that the preamp’s own contribution is unresolved, and it will stay unresolved until the source is cleaner or the whole chain is characterised.
What the measurement does establish is narrower and still useful: at these levels, into this chain, the preamp is not the dominant source of distortion. That is a different claim from a distortion specification, and it is the true one.
The pickup that was not the circuit
At the output connector the scope showed a fast component, reported at about 100 mV and 4 ns. It persisted with the probe tip shorted to its own ground, and it shrank when the scope bandwidth was limited to 20 MHz.
That combination settles the narrow question and leaves the broad one open. It proves the measurement setup can show that trace without any differential signal arriving from the board, so it is pickup in the probe loop rather than proof of oscillation. It does not prove the board is clean. The way to settle that is a short ground spring, a ×10 probe at the output and at Q3’s emitter before R12, at full bandwidth, with the board running — which is the next session.
What is still open
| Check | What it will settle |
|---|---|
| DC conditions | Rails, supply current, output offset, the drops across R5, R10 and R11, and drift after warm-up |
| Noise | Output noise with the input terminated, with the bandwidth stated |
| Headroom and clipping | Where it clips, how it recovers, and the power-on and power-off transients |
| Loaded stability | Behaviour into the intended cable and load, not into a scope probe |
| Upper bandwidth | The real −3 dB point, by sine sweep rather than by model |
| Second channel | Gain, offset and noise against the first, and transients with the following stage connected |
None of these is exotic. Each of them is a check I have not yet done, and the report says so plainly rather than leaving a blank where a number should be.
Why publish this
The gain flatness is unremarkable, and that is the point. A stage that holds 0.046 dB across the audio band and lags by a degree at 20 kHz is an engineered object behaving as designed; there is no story in it, only evidence.
The distortion figure is the interesting one precisely because I cannot print it. Anyone can write “ultra-low distortion” on a page. Publishing the input spectrum next to the output spectrum, and admitting that they are the same to within the resolution of the test, is harder and worth more.
This is a bench characterisation of the preamp module alone. The power amplifier, the loudspeaker load and the rest of the Field 25 chain will need their own integration measurements before any of this becomes a specification.
Leave a Reply